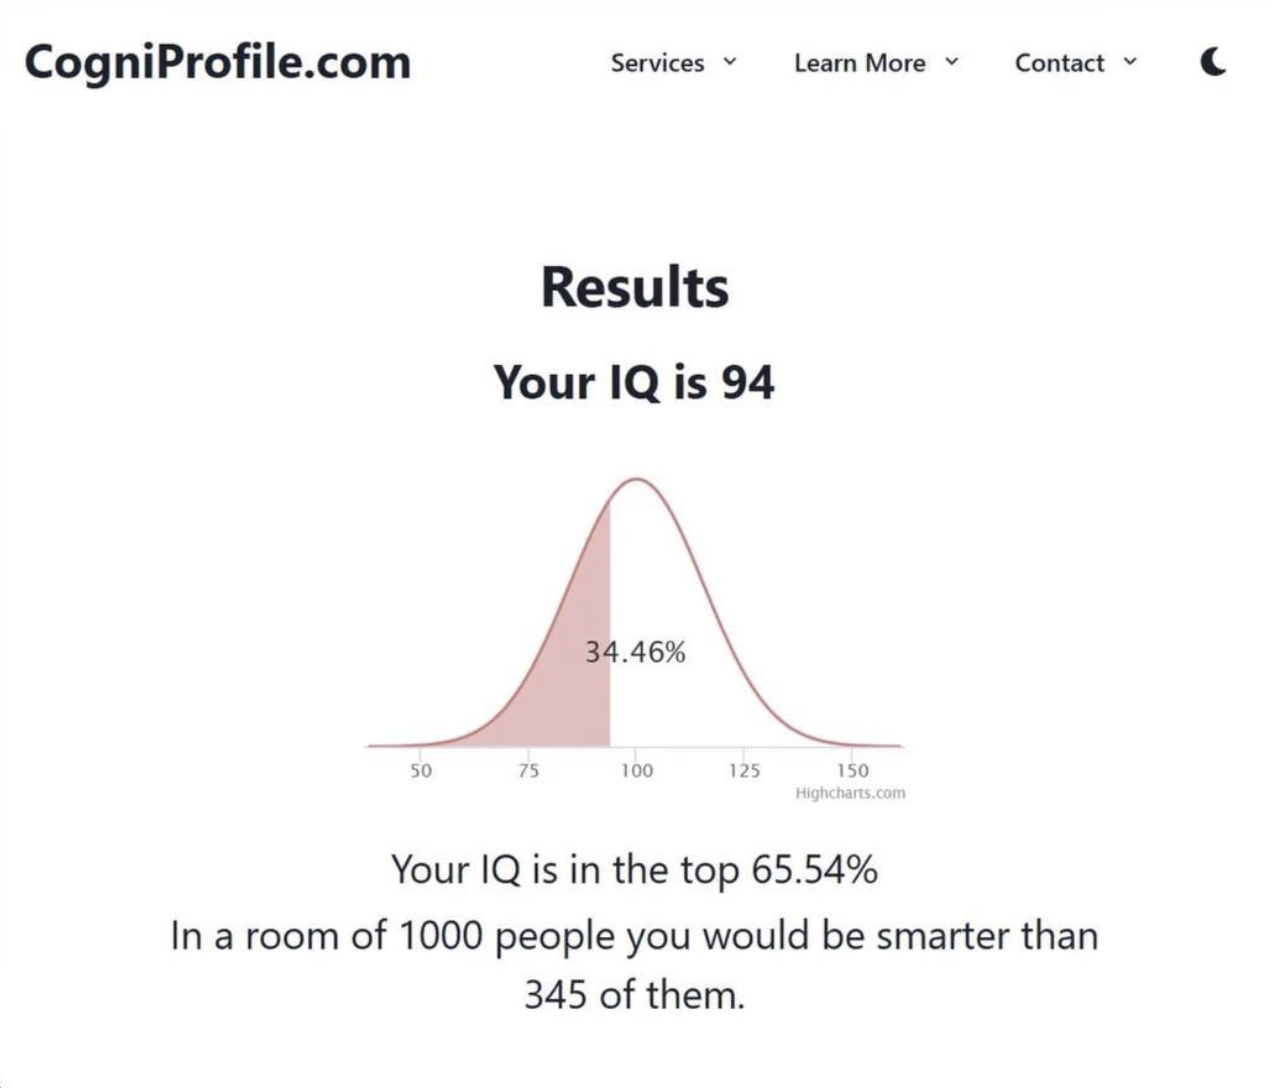
mudkip@lemdro.id to Crappy Design@sh.itjust.worksEnglish · 6 months agoSent this to my friends flexing a "top 65%" score. The site didn't make it clear that's not a good thing.files.catbox.moeimagemessage-square29linkfedilinkarrow-up163arrow-down129cross-posted to: [email protected]
arrow-up134arrow-down1imageSent this to my friends flexing a "top 65%" score. The site didn't make it clear that's not a good thing.files.catbox.moemudkip@lemdro.id to Crappy Design@sh.itjust.worksEnglish · 6 months agomessage-square29linkfedilinkcross-posted to: [email protected]
minus-squaresplendid9583@kbin.earthlinkfedilinkarrow-up2·6 months agoIt seems that IQ tests are always used with a normal distribution. For modern IQ tests, the raw score is transformed to a normal distribution with mean 100 and standard deviation 15. I don’t know whether IQ/intelligence is actually normally distributed, but it seems that IQ test results are. To find a graph that better matches what you described, you might be interested in https://en.wikipedia.org/wiki/Cumulative_distribution_function and/or https://en.wikipedia.org/wiki/Skewness


It seems that IQ tests are always used with a normal distribution.
I don’t know whether IQ/intelligence is actually normally distributed, but it seems that IQ test results are.
To find a graph that better matches what you described, you might be interested in https://en.wikipedia.org/wiki/Cumulative_distribution_function and/or https://en.wikipedia.org/wiki/Skewness